Chapter 5
Logic errors identifying and evaluating English learners
Table of Contents
Chapter 5 Overview
This chapter first looks at the misidentification of English learners – the logic that drives the interpretation of the Home Language Survey, and the tests that districts use to confirm whether a student is indeed an English learner. The chapter also examines the difficult process of determining when those students are ready to be reclassified as English fluent. The way that districts create long-term English learners (LTELs) is explored in a summary of the research of Estrada and Wang (2018). Districts’ successes in advancing ELs to English fluency are not visible, but could be properly counted by using the category of “ever-ELs.” Using “ever-ELs” to measure the progress of English-learner students toward reclassification would reveal the exceptional progress now masked by current measurement methods.
Chapter 5 Excerpt
The mismeasurement of students who are considered by districts to be English learners is all-too-common, highly consequential, and in some cases, illegal. Three factors collide. First, there’s the semantic confusion. After all, we’re always learning English. What is the line that distinguishes the degree of English fluency of a 6-year-old from a family that speaks English only, from a 6-year-old whose family speaks Spanish and occasional English? Second, there’s the logic problem of trying to define the attributes of a group of people whose members change over time. Today’s English learner may very well be reclassified next year as English fluent. Third, there’s the measurement problem itself. How, exactly, do you assess kindergartners’ four dimensions of fluency—reading, writing, speaking and understanding—reasonably accurately, and then combine those four factors into one number that’s well suited for a decision that has huge consequences for the student, and expensive consequences for the district?
In the interest of untangling the mess that’s been made of this, we will proceed with care, in light of the harm that has resulted from misidentifying students at the start of this process; creating high hurdles for them to clear to exit English learner status; misclassifying some English learners as students with disabilities or special education students; and denying English learner students access to the core curricula and college-prep electives.
Let’s begin to untangle the semantic and logical confusion by pretending we’re a visiting delegation of Vulcans from the Starship Enterprise. Vulcans are high in logical thinking and low in emotional intelligence. To understand what makes an English learner different from other students, we have to ask the Earthlings some naïve, fundamental questions.
Aren’t all 5- and 6-year-old students learning English? Why do you only call some of them English learners?
Why are some students who have partial mastery of two languages called multilingual, and others called English learners?
How do you know when they have learned English?
How long might a quick learner take to become English fluent? How about a slower learner?
When students are unable to write, how can you evaluate their thinking or determine if they’ve learned a lesson?
We Vulcan visitors have by now discovered that academic English is an entirely different flavor of English than that which is written in text messages or spoken on the playground. We’ve also learned that the key to school is reading and that the language of instruction is English. So those who can’t read English or those who can’t decode English words can’t get to the knowledge and skills they’re supposed to attain. We can now unravel this riddle, viewing the strange, illogical habits of earthlings from the Vulcan’s point of view….
Chapter 5 Resources
Bialik, Kristin, Alisa Scheller and Kristi Walker, “Six facts about English language learners in U.S. public schools,” Pew Research Fact Tank, October 25, 2018. Accessed on 9/1/2020 at https://www.pewresearch.org/fact-tank/2018/10/25/6-facts-about-english-language-learners-in-u-s-public-schools/
California Department of Education, “California English Language Development Test: A Comparison Study of Kindergarten and Grade 1 English-Fluent Students and English Learners onthe 2010–11 Edition of the CELDT,” October 25, 2011, 80 pages. Accessed on October 20, 2020 from https://www.cde.ca.gov/be/pn/im/documents/imadaddec11item02a1.pdf
Education Commission of the States, “50 State Comparison: What measures do states use to reclassify students as English proficient?” (November 2014), downloaded on 8/29/2020 from http://ecs.force.com/mbdata/mbquestNB2?rep=ELL1407
Estrada, Peggy and Wang, Haiwen, “Making English Learner Reclassification to Fluent English Proficient Attainable or Elusive: When Meeting Criteria Is and Is Not Enough,” American Educational Research Journal, April 2018, Vol. 55, No. 2, pp. 207–242.
Estrada, Peggy and Wang, Haiwen, “Reclassifying and Not Reclassifying English Learners to Fluent English Proficient, Year 1 Findings: Factors Impeding and Facilitating Reclassification and Access to the Core,” a paper presented at the annual meeting of the American Educational Research Association, San Francisco, California, May 2013.
Hakuta, Kenji; Butler, Yuko Goto; Witt, Daria, “How Long Does It Take English Learners To Attain Proficiency?” Stanford University and The University of California Linguistic Minority Research Institute, January 2000, 32 pgs. Accessed August 31, 2020 from https://eric.ed.gov/?id=ED443275
Institute for Education Science, National Center for Education Statistics, “English Language Learners in Public Schools,” updated May 2020. Accessed on 9/1/2020 at
https://nces.ed.gov/programs/coe/indicator_cgf.asp
Olsen, Laurie, “Reparable Harm: Fulfilling the Unkept Promise of Educational Opportunity for California’s Long Term English Learners,“ Californians Together, 2010, 68 pgs. https://www.californianstogether.org/reparable-harm-fulfilling-the-unkept-promise-of-educational-opportunity-for-californias-long-term-english-learners/
Stokes-Guinan, Katie and Goldenberg, Claude, CATESOL Journal, “Use With Caution: What CELDT Results Can and Cannot Tell Us,” v22 n1, 2010-2011, pgs 189-202. https://eric.ed.gov/?id=EJ1111981

”Educators and parents are awash in data, but how can they correctly use it? This thoughtful book points out some of the many ways in which educational data are misused and offers concrete guidance to do better. Any program preparing teachers or school leaders who will be working with assessment or other educational data could benefit from reading this candid, approachable book.“
Morgan Polikoff – Associate Professor of Education, USC Rossier School of Education
Chapter 5 Data Visualizations
Figure 5.1 - EL Students Making Progress Toward Proficiency, Class of 2024: Napa Valley USD alone
This depicts the year by year percentage of students in the class of 2024 who were at any time considered to be English learners who have attained English fluency. Over these five years, this cohort of students progressed from grade 3 through grade 7.
Figure 5.2 - EL Students Making Progress Toward Proficiency, Class of 2024: Napa Valley USD and 15 Similar Districts
This compares Napa Valley USD to 15 districts with highly similar students, showing over five years the percentage of students in the class of 2024 who were at any time considered to be English learners who have attained English fluency.
Figure 5.3 - EL Students Making Progress Toward Proficiency, Class of 2024: Napa Valley USD and Fairfield-Suisun USD
Figure 5.3 compares Napa Valley USD to just one district nearby whose students are very similar, showing over five years the percentage of students in the class of 2024 who were at any time considered to be English learners who have attained English fluency.

Figure 5.4 - Class of 2024, Reclassified Fluent: Smarter Balanced Test Results: Napa Valley USD and 15 Similar Districts
Figure 5.4 compares the math scores of reclassified English learner students in Napa Valley USD’s class of 2024 over five years’ time, from grade 3 through grade 7, to those of reclassified English learners in 15 highly similar districts. The test was California’s version of the Smarter Balanced test, and both English language arts (left panel) and math (right panel) are presented.
Figure 5.5 - Never EL (English-Only) and Reclassified English-Fluent Students' Scores on SBAC, Math 2019, Grades 3-8
Figure 5.5 depicts the 2019 test scores in math of districts’ never-EL (English-only) students and reclassified EL students. Scores are mapped to values on horizontal and vertical axes. Students are in grades 3-8, and the test metric is the percentage of students meeting or exceeding the math standard. English-only students’ scores can be read from the vertical axis, and the scores of reclassified English learners can be read from the horizontal axis. Each dot is a district, and the diagonal line represents the point where the scores of both groups of students is identical.
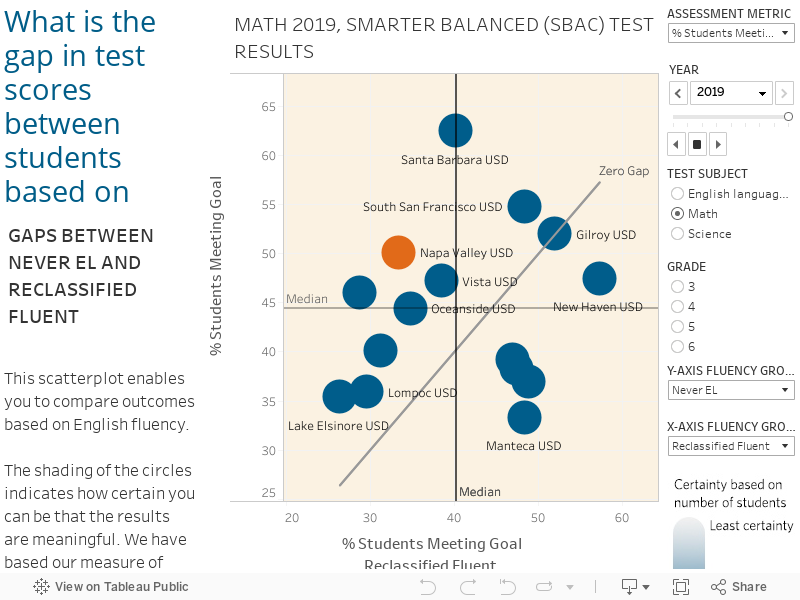
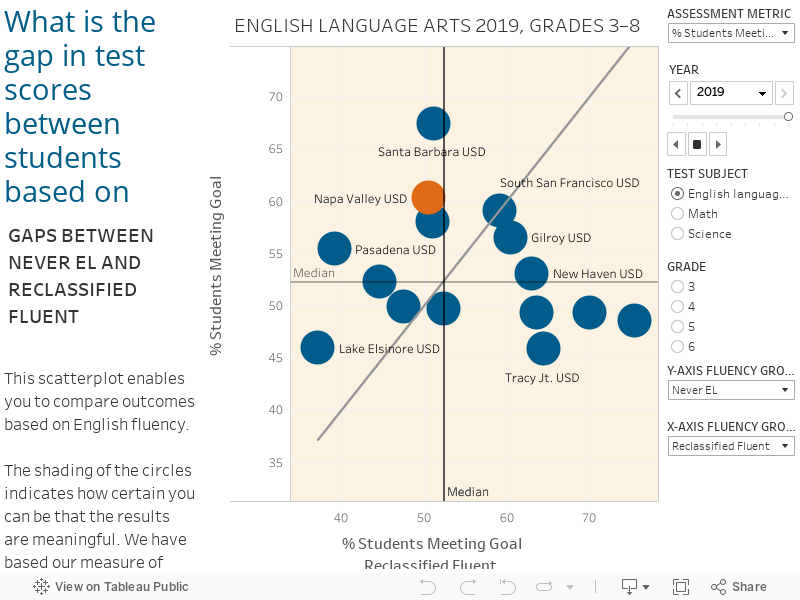
Figure 5.6 - Never EL (English-Only) and Reclassified English-Fluent Students' Scores on SBAC, English Language Arts, 2019, Grades 3-8
Figure 5.6 depicts the 2019 test scores in English language arts of districts’ never-EL (English-only) students and reclassified EL students. Scores are mapped to values on horizontal and vertical axes. Students are in grades 3-8, and the test metric is the percentage of students meeting or exceeding the math standard. English-only students’ scores can be read from the vertical axis, and the scores of reclassified English learners can be read from the horizontal axis. Each dot is a district, and the diagonal line represents the point where the scores of both groups of students is identical.