Thanks to Sean Reardon’s team at the Stanford Educational Opportunity Project, and Tom Kane’s team at the Harvard Center for Education Policy Research, the evidence of impact of the interruption of schooling during the pandemic is now visible. The theme: variation is big.
By doing the statistical heavy lifting required to cobble together data on time spent district by district delivering remote instruction, the data on students’ results on state tests and on the Nation’s Report Card (NAEP), and more, they were able to build evidence of a highly unusual sort.
Their visualization of this evidence allows you to see:
- changes in test results from 2019 to 2022 expressed as the rough equivalent of grade levels (the language the public understands;
- results for all states and some districts (many districts’ data is missing);
- results for math and English language arts for grades 3-8;
- juxtaposition of changes by the degree to which a district relied on remote instruction;
- juxtaposition of changes by the percentage of students receiving free-or-reduced price meals;
- juxtaposition of changes by the percentage of a district’s budget that ESSR (federal) funds represent;
This was a big, big collaboration. Seven organizations in addition to Stanford and Harvard put this together. The list includes NWEA, Dartmouth College, National Center for Education Statistics, the EduNomics Lab at Georgetown and the American Enterprise Institute. If you want to dig in yourself to understand their method, you’ll find it explained here.
Dive in to see the state by state comparisons here.
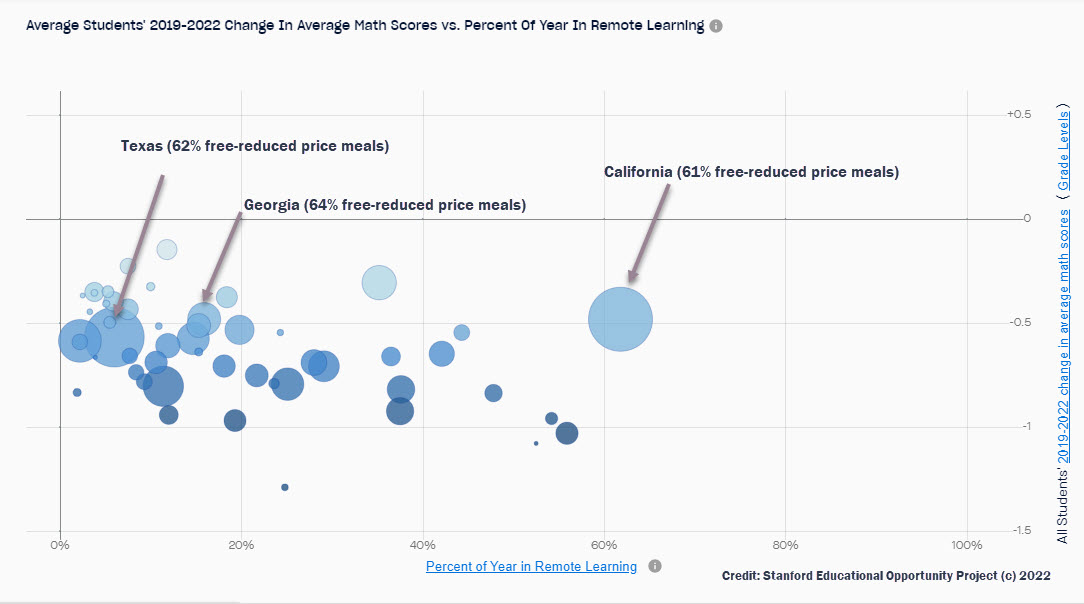
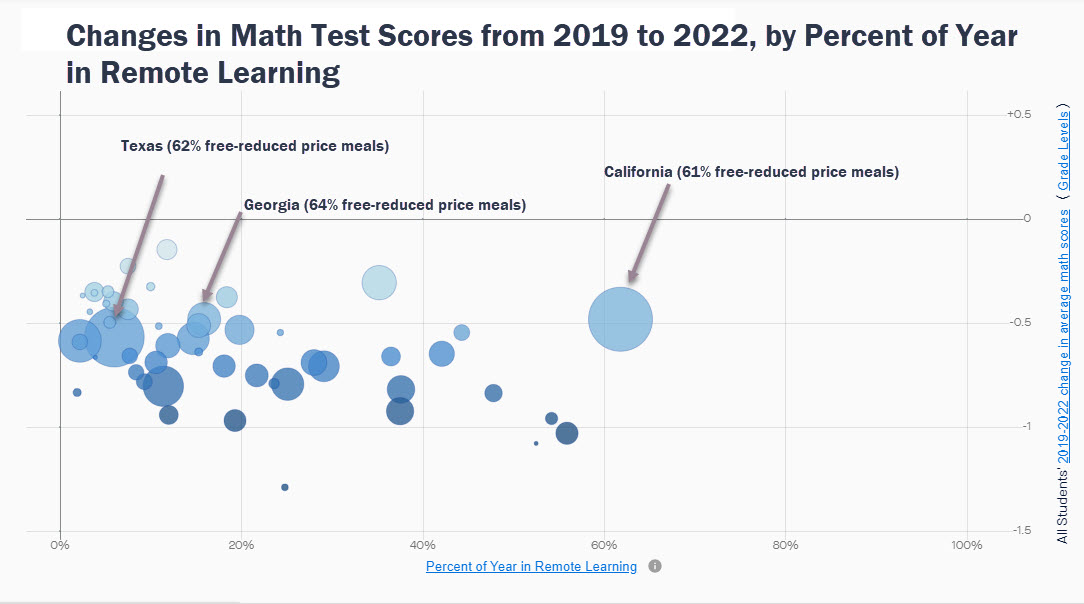
Texas and Georgia skew to the left, with Georgia showing about 18 percent of the year spent delivering remote learning, and Texas showing about 6 percent. California, always the outlier, skewed to the right showing about 62 percent of the year delivering remote learning. Yet all three states showed about the same degree of setback in their 3rd to 8th grade students’ math results (2022 compared to 2019): about the equivalent of half a grade level.
To see the comparison of three California districts that appears below, click on the link here.
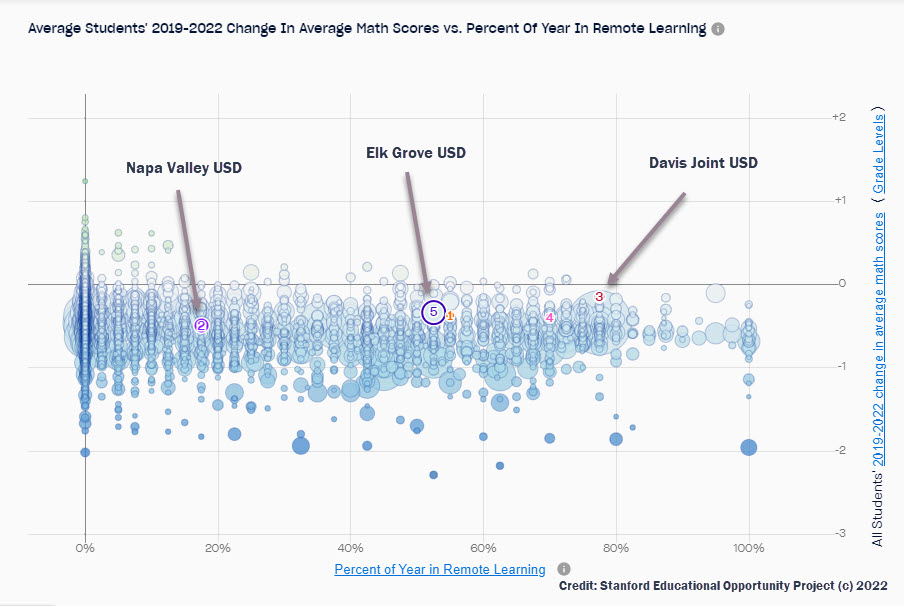
Note that the setback in math scores for students in each of the three districts (reading from left to right, 2, 5 and 3) (Napa Valley, Elk Grove, and Davis Joint USD, respectively) was roughly comparable for Napa Valley USD and Elk Grove USD, while Davis Joint USD students did even better:
- about 1/2 of a grade level in Napa Valley USD;
- about 1/3 of a grade level in Elk Grove USD; and
- about 1/7 of a grade level in Davis Joint USD.
Yet the degree to which they balanced remote instruction with classroom instruction varied enormously:
- about 17 percent of the time was remote instruction in Napa Valley USD
- about 53 percent of the time was remote instruction in Elk Grove USD; and
- about 77 percent of the time was remote instruction in Davis Joint USD.
I’m delighted to see this high quality evidence in visual form, ready for curious souls to scrutinize, question, and interrogate. But I’m not yet ready to venture any generalizations given the wide variation in results. If you’re ready to venture a hypothesis, let it fly. Just send your comments to me via email.